Projects and Experiments:
Beat The Market
Beat The Market
Beat the market is an application that constructs an optimal equity portfolio. By adding their records, users can view their P&L and Investment recommendation which uses a machine-learning algorithm that provides predictive insights supporting smart investment decisions. The available functions are Bookkeeping stock holdings, Monitoring P&L, Portfolio allocation recommendation, Market news.
Bitcoin Price Prediction

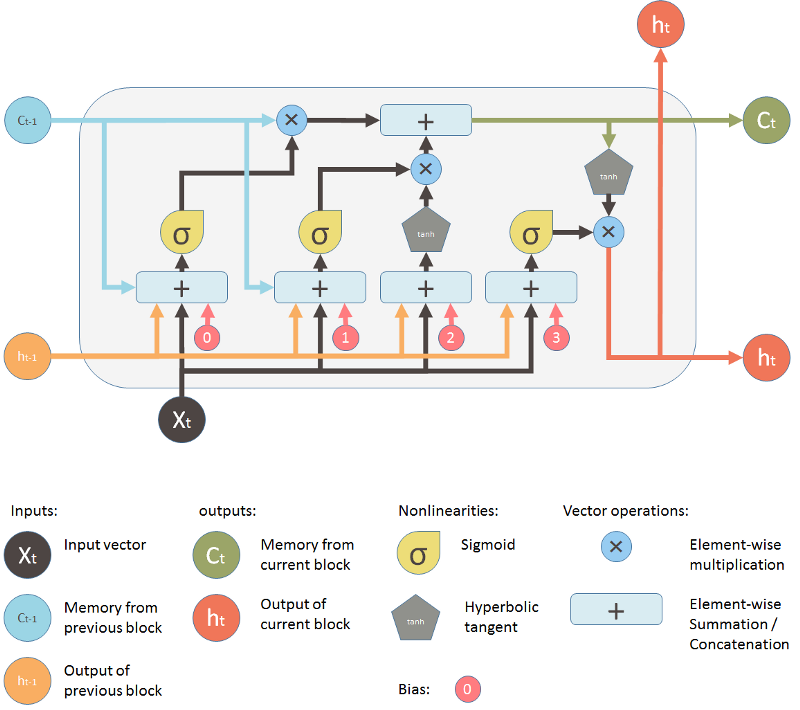
Bitcoin Price Prediction
This predictive modeling for Bitcoin Price uses Gold and S&P 500 data implementing LSTM, Gradient Boosting Regression, and Random Forest. The technology used includes Scikit-learn, Keras, Tensorflow, Pandas, Numpy, Beautifulsoup, Requests, and Statsmodels.
Cryptocurrency Trading Demo
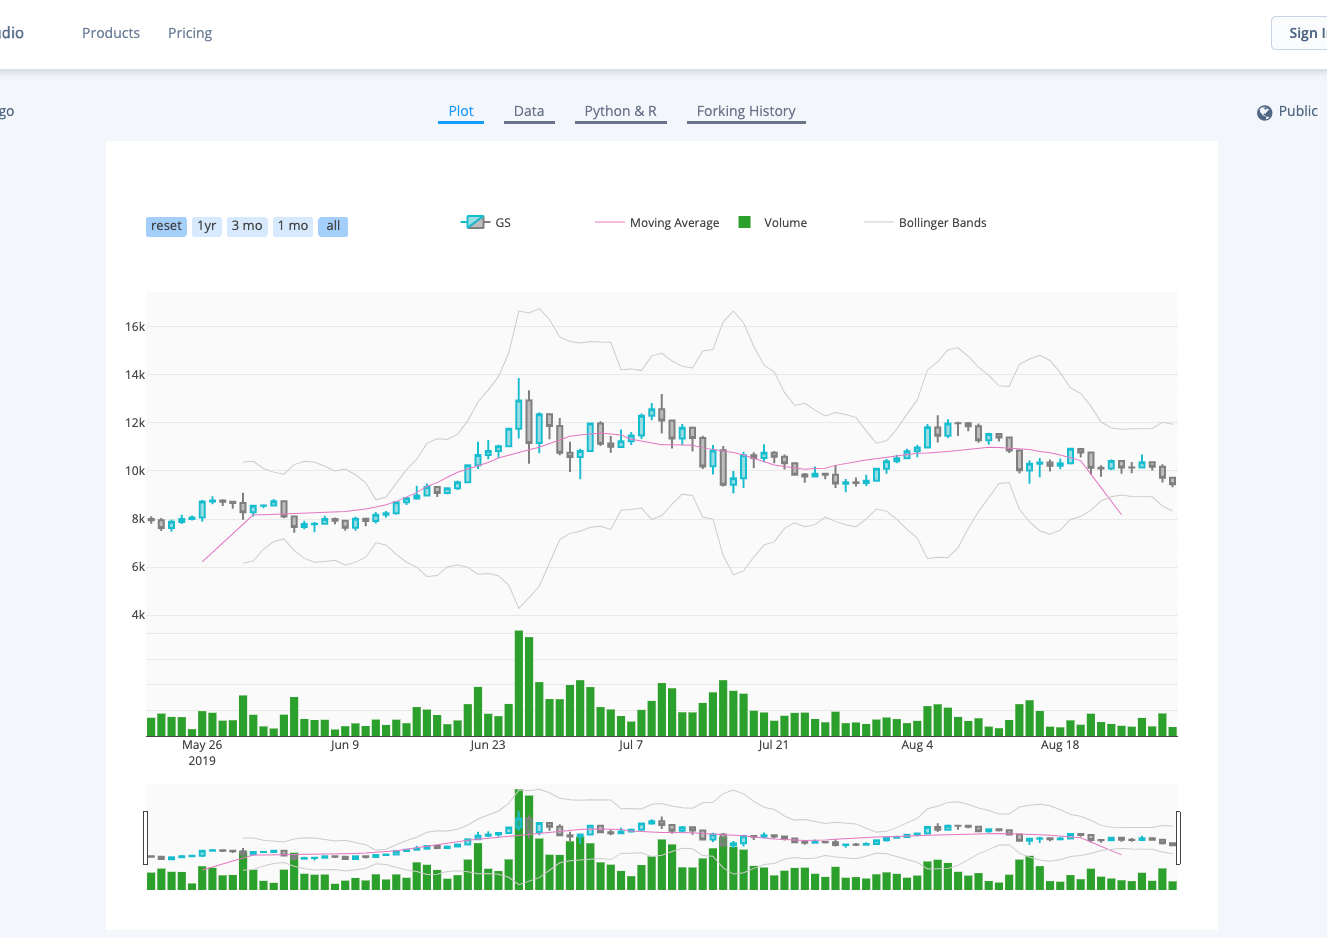
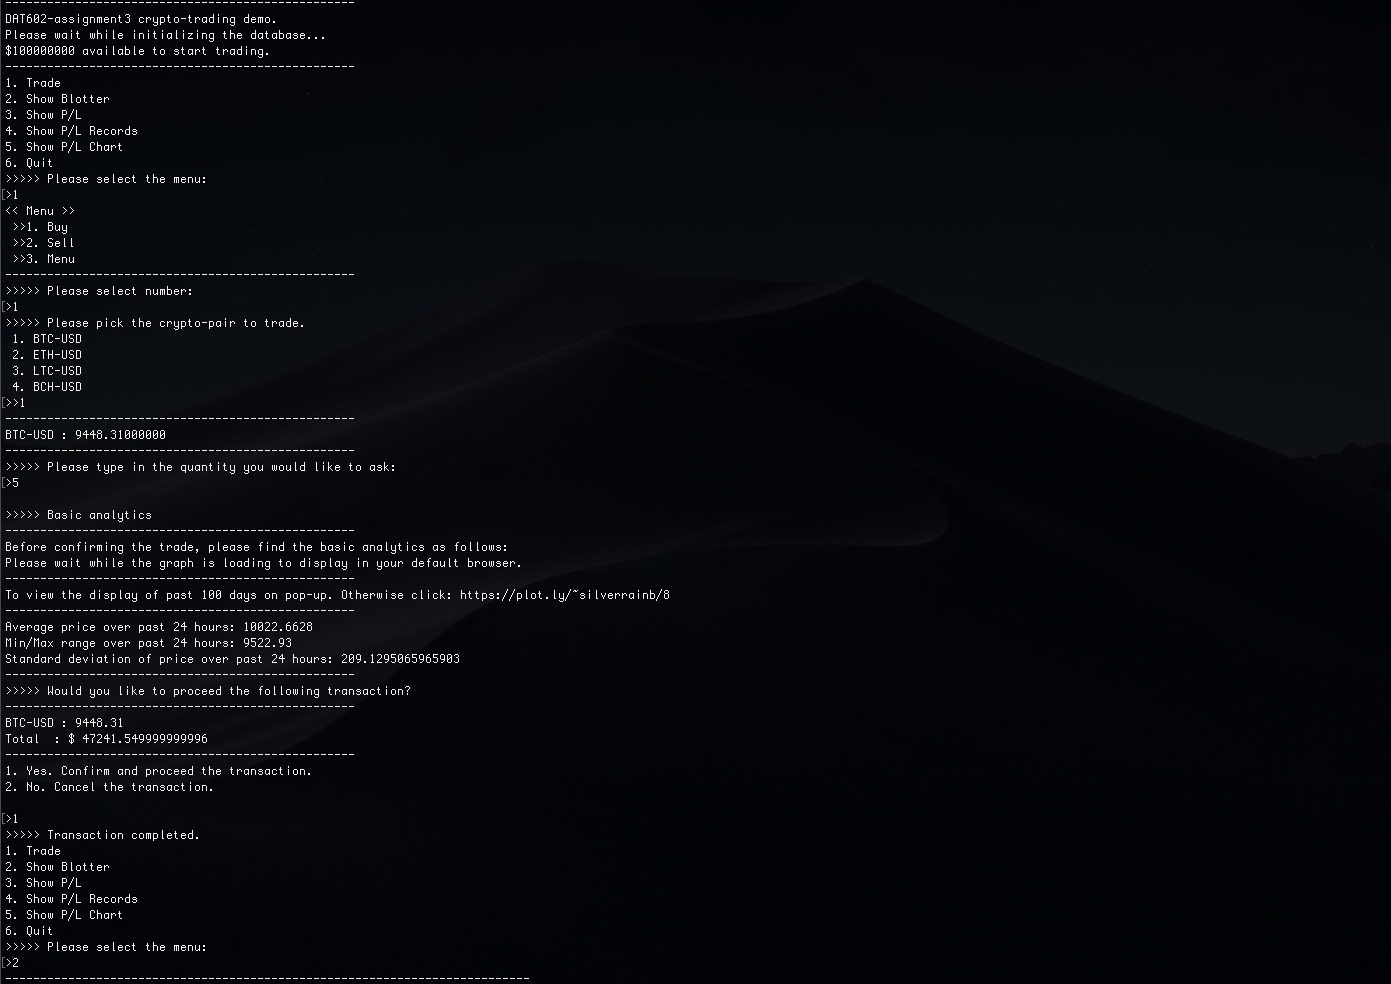
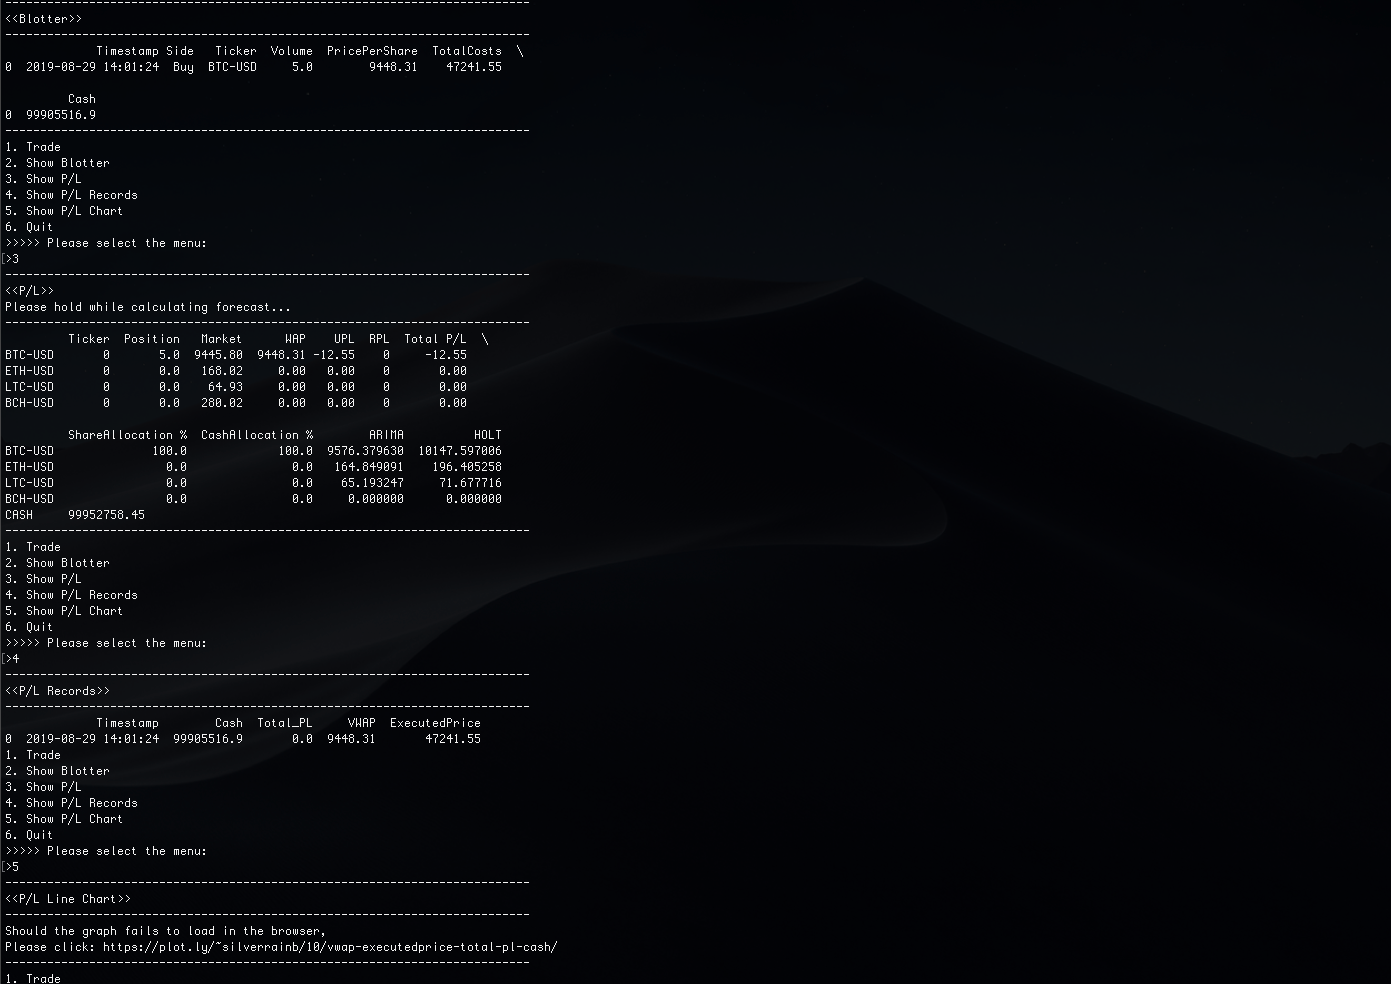
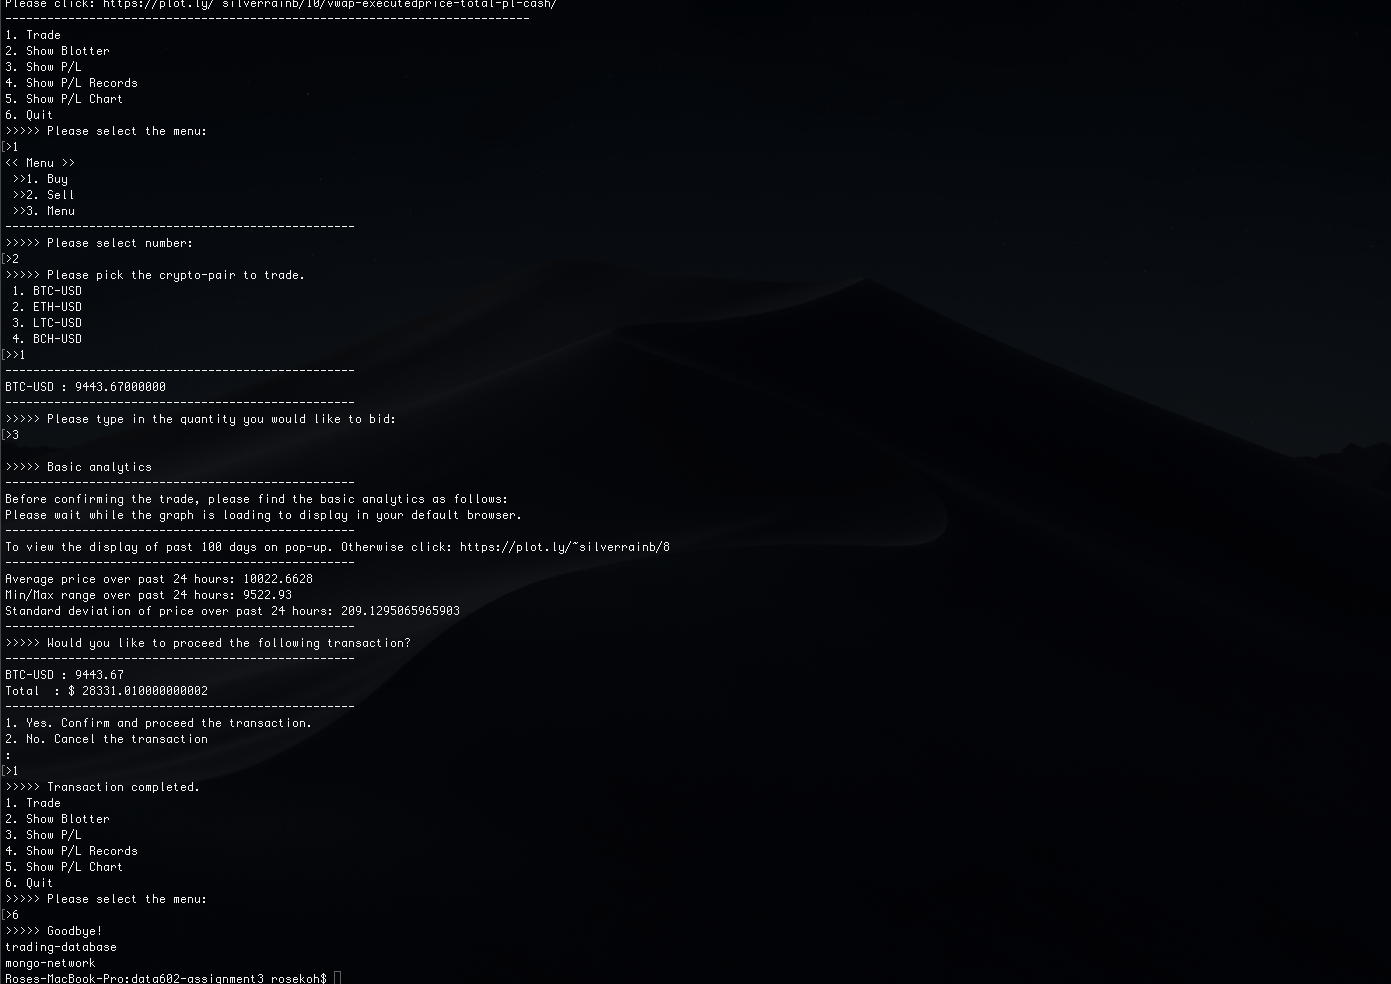
Cryptocurrency Trading Demo
This is a console-based application built-in Python, using real-time data via GDAX API. The application takes orders, maintains a blotter and P/L. This project demonstrates usage of Python, EC2, MongoDB, Docker and applied predictive modelling. To start, please refer to documentation on github.
Forecasting S&P500 Market Direction using Technical Indicators and ML Algorithms
Forecasting S&P500 Market Direction using Technical Indicators and ML Algorithms
This research applies and analyses the effectiveness of Random Forest, Gradient Boosting Machine (XGBoost implementation), Multi-Layer Perceptron, and Recurrent Neural Network Long Short-Term Memory in the context of statistical trading. In this research, we summarize the differences of these models from a technical point of view and compare their performance using metrics for classification accuracy. Each model is trained on returns of the S&P 500 index price from 1983 to 2019 with multiple lagged periods. All training processes use nested cross validation and random coarse to fine hyperparameter tuning. The day over day market direction is predicted based on the feature-engineered variables and momentum-based technical indicators.
Binary Logistic Regression Models - Auto Insurance

Binary Logistic Regression Models - Auto Insurance
Explore, analyze, and model a data set containing approximately 8000 records representing a customer at an auto insurance company. Response variable TARGET_FLAG is 1|0, 1 meaning the person was in a car crash. The second response variable is TARGET_AMT, if the value is zero the person did not crash their car. The objective of this study is to build multiple linear regression and binary logistic regression models on the training data to predict the probability that a person will crash their car and also the amount of money it will cost if the person does crash their car.
Recommender System - Instacart Market Basket

Recommender System - Instacart Market Basket
Which products will an Instacart consumer purchase again? As supply chain management and retail tech are growing at a faster pace, maintaining a log and predicting customer’s next purchase is a highly valuable use case for Data science. Leveraging python and spark, this recommender system predicts the user’s next purchase, using Instacart market basket data.
Sentiment Analysis on Movie Reviews

Sentiment Analysis on Movie Reviews
This kaggle project is from Sentiment analysis on Movie Reviews. The challenge is to classify the sentiment of sentences from the Rotten Tomatoes Reviews Dataset. Using SGD Classifier and XGBoost, we reached score at 63.426%, which was within the top 10% at the time of submission. Technology used includes pandas, numpy, nltk, wordcloud, scikit-learn, and xgboost.
Predictive Modeling - Wine Sales

Predictive Modeling - Wine Sales
The wine prediction project uses a count regression model to predict the number of cases of wine that will be sold given certain properties of the wine. The dataset includes approximately 12,000 commercially available wines. The variables are mostly related to the chemical properties of the wine being sold. The response variable is the number of sample cases of wine that were purchased by wine distribution companies after sampling a wine. These cases would be used to provide tasting samples to restaurants and wine stores around the United States. The more sample cases purchased, the more likely is a wine to be sold at a high-end restaurant. A large wine manufacturer is studying the data to predict the number of wine cases ordered based upon the wine characteristics. If the wine manufacturer can predict the number of cases, then that manufacturer will be able to adjust their wine offering to maximize sales.
Career Relocation Estimator
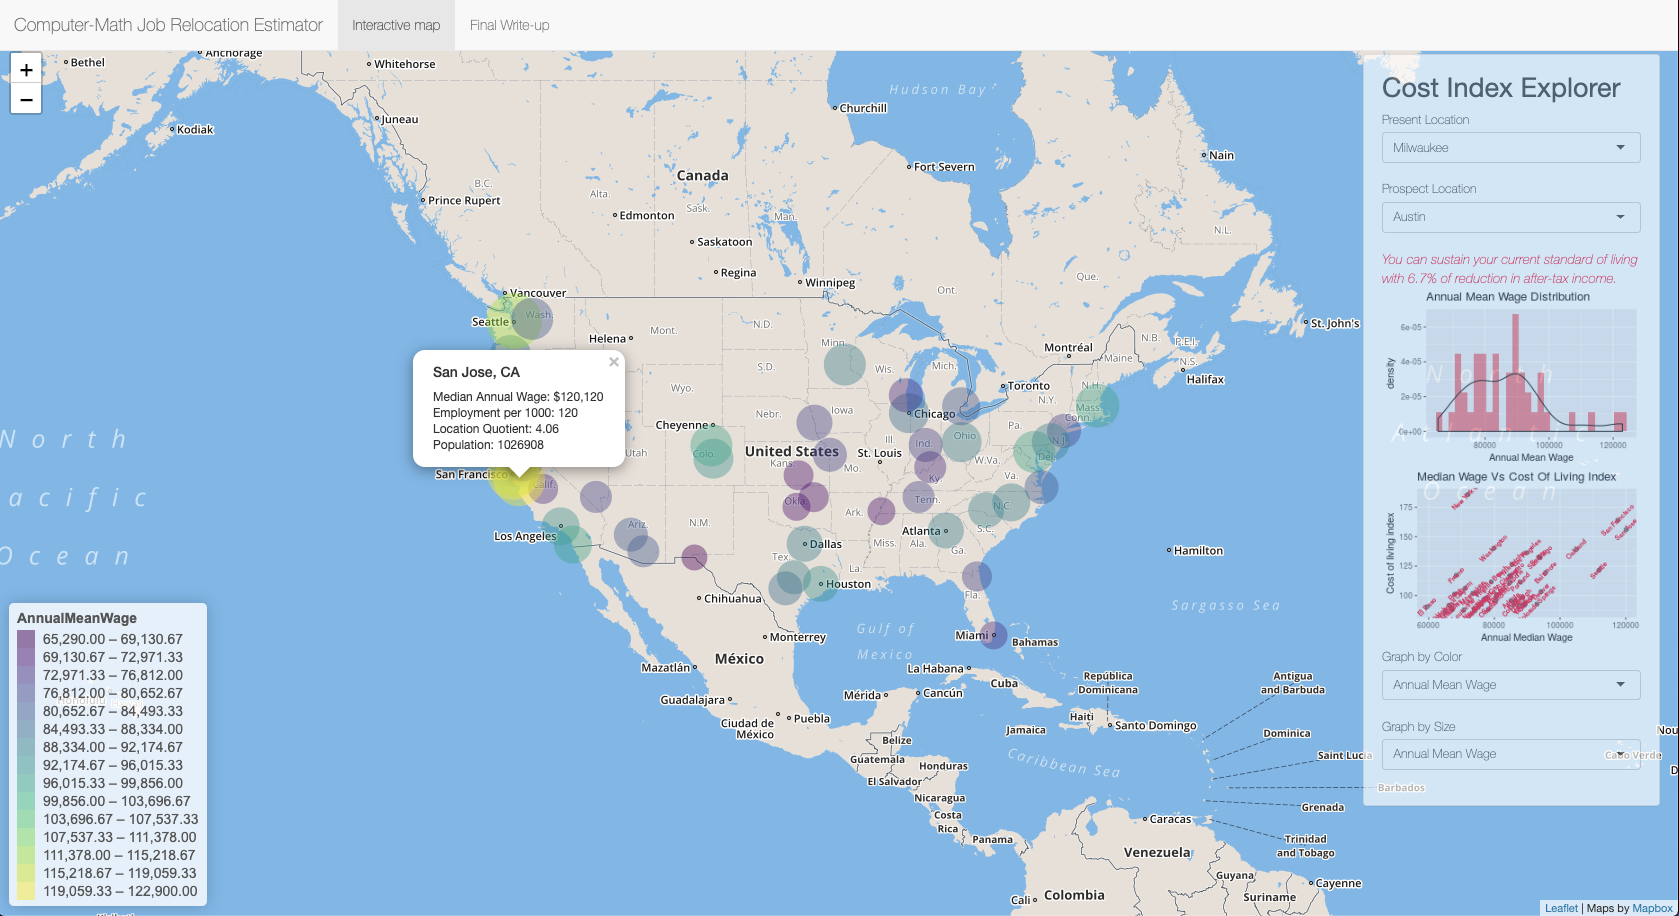
Career Relocation Estimator
This shinyR visualization is built to provide a cost estimate for relocation. Using the Occupational Employment Statistics data for the Computer and Mathematical Occupations (Major Group), this application plots the top 50 Urban Areas sorted by population with detailed information such as Median annual wage, Mean annual wage, Population, Employment, Employment per 1000, Location Quotient and Cost of living index, inside a tooltip which is accessible through a click. The estimator calculates costs of relocation by calculating the standard of living comparing the present and prospect of location and provides an instant statement. The tooltip includes information in text and you can access the information by clicking the circles on the map. On the bottom of the Cost Index Explorer panel, you have an option to view the graph by Color or Size of drop-down variables.